Is there any correlation between union density and the growth or decline in employment? In the graph below, the block to the left of the vertical axis expresses union density (defined as a percentage of the economically active population). The right-hand side of the vertical axis shows the formal employment growth or decline.
Union density and employment growth in South Africa, 1980-2004
.png)
Source: SAIRR; Statistics South Africa
It is uncanny how closely these two curves are aligned. Of course, all this graph illustrates is that there is a correlation between union density and the growth rate of formal employment in South Africa. It does not mean that higher union density causes the employment growth rate to decline.
It is important to remind ourselves at this point that what we are measuring as union density is union membership expressed as a percentage of the economically active population, not as a percentage of the working population. So union density will not change if job growth goes up or down. The causal relationship is rather that changes in union density drive changes in job growth.
The relationship between high union density and sluggish job growth is not unique to South Africa. In 2003, American economists measured the correlation between union density and employment growth in a number of states in the US termed ‘peer states’ of Pennsylvania because of the similarity of their underlying economies or their proximity to that state.[i] While the states were economically similar in many ways, they differed sharply in the relative degree of their union density and their employment growth.
Here is a graph showing the relationship between union density and job growth (in this case, union density is expressed not as a percentage of the economically active population, but as a percentage of the total number of employed in each state):
Union density and employment %: US north-eastern states
.jpg)
Source: Paul F. Stifflemire Jr
There is a very clear trend. In states where union density was high, such as New York (which had a density of 32 per cent), job growth over the relevant period was very low (in the case of New York, 14 per cent). In low-density states such as Virginia (a union density of 12 per cent), job growth over the same period was high (almost 60 per cent in the case of Virginia).
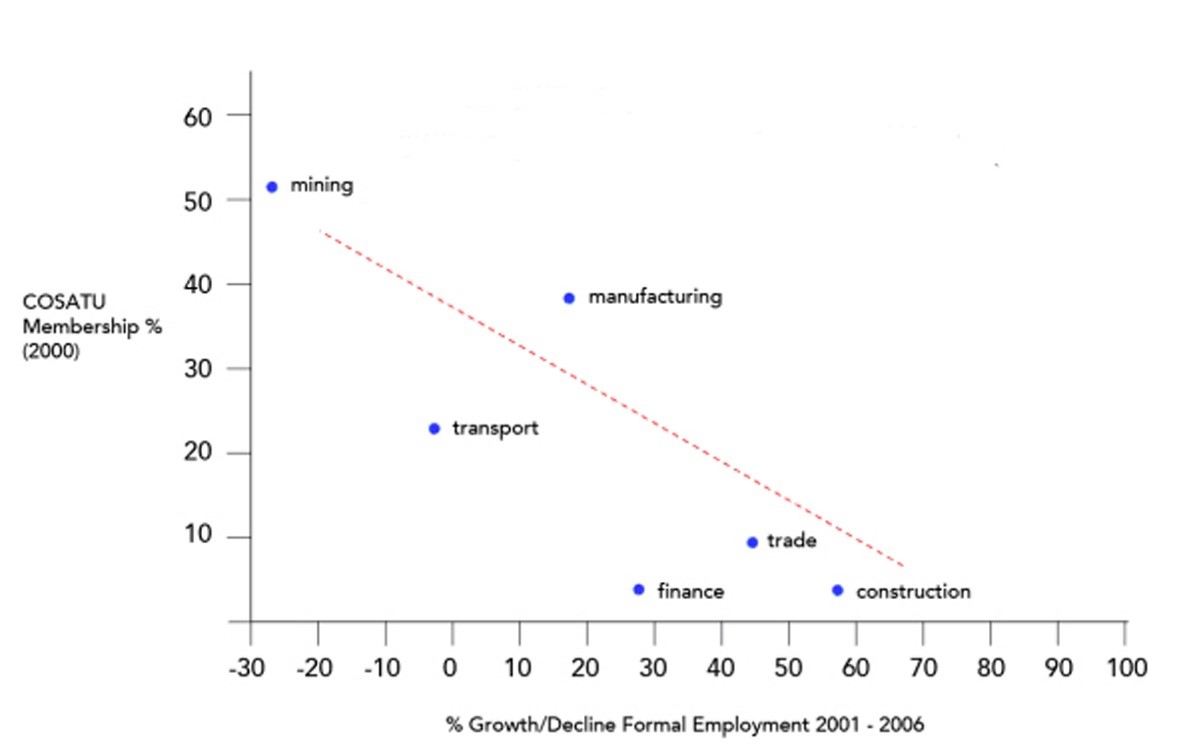
Another way of looking at this is to divide South Africa into industries that are potentially sensitive to union density, and to compare their results. The following graph compares COSATU membership expressed as a percentage of formal employment in 2000 with the percentage employment growth/decline in the mining, manufacturing, transport, trade, finance and construction industries in the period 2001-2006.
COSATU membership percentages vs. employment growth/decline

Source: SAIRR; Statistics South Africa
Here, the union-membership percentages relate to 2000, while the change in employment relates to the six-year period after that. Once more, this is consistent with the notion that union density suppresses employment growth.
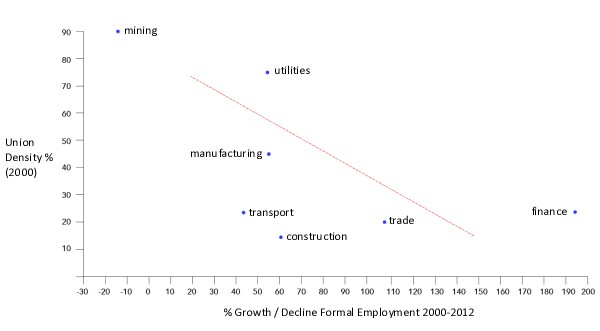
The following graph shows a different period (2000-2012) and uses union membership of all unions (not just COSATU). The results are similar:
Trade union membership percentages vs. employment growth/decline

Source: SAIRR; Statistics South Africa
Research in the US also confirms the relationship between high union density and low employment growth. The Heritage Foundation examined changes in employment in unionised and non-unionised plants in the US manufacturing industry over the period 1977-2008.[ii] Over that period, employment in manufacturing in non-unionised plants grew from 12.5 million to 13.3 million, while in union plants it declined from 7.5 million to 1.9 million.
Quite clearly, while jobs grew slightly in non-unionised plants, they dropped steeply in unionised plants. Similarly in the construction industry in non-union enterprises jobs grew from 2.5 million to 6.4 million, while in union businesses it declined from 1.5 to 1.2 million.
In 1947, the United States passed the Taft-Hartley Act, which affirms the right of states to enact right-to-work laws. Under these laws, employees in unionised workplaces may not be compelled to join a union or pay for any part of the cost of union representation. In anticipation of Michigan’s adoption of right-to-work laws in 2013, the Mackinac Center for Public Policy in Michigan examined the economic effects of right-to-work status. Here are some of its most striking findings:
- ‘According to the Bureau of Economic Analysis, right-to-work states showed a 42.6 percent gain in total employment from 1990 to 2011, while non-right-to-work states showed gains of only 18.8 percent.’
- ‘According to the U.S. Census Bureau, population increased in right-to-work states by 39.8 percent and only 16.7 percent in non-right-to-work states from 1990 to 2011.’
- ‘According to the U.S. Census Bureau, 4.9 million people moved from non-right-to-work states to right-to-work states from 2000 to 2009.’
- ‘According to the Bureau of Economic Analysis, nominal personal income grew by 209.3 percent in right-to-work states and by 148.5 percent in non-right-to-work states from 1990 to 2011.’[iii]
For our purposes, the most significant impact is on employment growth. Right-to-work states in the period 1970-2011 grew employment at a rate exceeding that of non-right-to-work states by 0.8 percentage points per year. Importantly, despite growing jobs roughly three times faster, right-to-work states did not sacrifice in terms of personal income. On the contrary, according to the study ‘states with right-to-work laws enjoyed an annual average increase in real personal income of 0.8 percentage points … compared to what they would have experienced without such laws’.[iv]
Unsurprisingly, right-to-work states have far lower union density than non-right-to-work states (8.83 per cent as opposed to 15.59 per cent). In terms of the evidence, that alone may explain the superior job performance of the right-to-work states.
Trade-union protection by law is a scandalous form of rent-seeking. Unions, aided by legislative protection, raise the cost of labour. In this country, with its growing army of unemployed people, there is simply no justification for this travesty to continue.
Author Frans Rautenbach, author of South Africa Can Work, is a Cape Town labour lawyer with ample experience of legal reform work, having consulted to the governments of Uganda and Tanzania on reform of labour legislation, licensing laws and business start-up procedures. He is a published author about legal reform, management systems and labour law.
[i] Paul F. Stifflemire Jr, ‘Unionism and economic performance: Pennsylvania and peer states’, Allegheny Institute for Public Policy report 03-02, May 2003, available at http://www.alleghenyinstitute.org/wp-content/uploads/components/com_reports/uploads/03_02.pdf (last accessed 2 April 2017).
[ii] James Sherk, ‘What unions do: What labor unions do and how it affects the economy’, Heritage Foundation, 21 May 2009, available at http://www.heritage.org/jobs-and-labor/report/what-unions-do-how-labor-unions-affect-jobs-and-the-economy (last accessed 11 April 2017).
[iii] Michael D. LaFaive and Michael J. Hicks, ‘Right-to-work laws improve economic well-being’, Mackinac Center for Public Policy, 28 August 2013, available at https://www.mackinac.org/19075 (last accessed 2 April 2017).