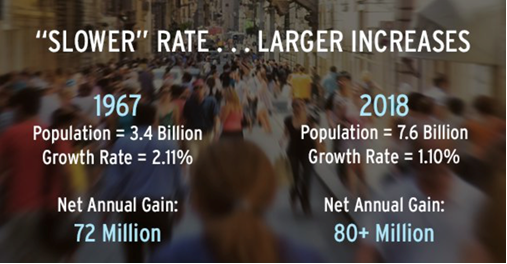
The Population Media Center is pushing the overpopulation panic again—that’s so 1960s! They proclaim, “If somebody tries to tell you that population growth is ‘slowing down’, ask them to explain the graphic on the left.” This is the graphic (below) and allow me to explain it — it isn’t that difficult.

First, note the graph shows declining growth! The growth rate was 2.11% in 1967 and 1.10% in 2018, a decline of almost 50%. The World Bank provides hard data: in 1970 world population was growing by 2.091% annually, by 1990 it was 1.741%, and by 2010 the growth rate was down to 1.204%. Today it is 1.109%.
PMC spends much of their time talking about birth rates, but growth rates and birth rates are not the same thing. You can have birth rates at or below replacement levels yet still have population growth. Growth rates are a combination birth rates and death rates.
With longer life expectancy, death rates will slow down — even though EVERY one of those people will eventually die.

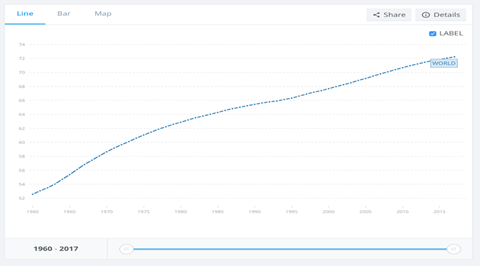
Life expectancy globally. Source World Bank.
In 1967 world life expectancy was just under 57 years; today it is over 72 years. The UN projects by 2050 global life expectancy will be 77.1 years.
Imagine a world where one child was born per year. The population would plummet. Now imagine, in addition, no one died. Even one child per year would see the total population increase. Population growth is not solely a result of birth rates.
If people live longer, the population will grow but the extension of human life is slowing down and eventually a massive die off will take place. Think of the Baby Boomers where a large number of births happened in just a few years. Those Boomers now are seniors and moving into that age group where death rates escalate dramatically. Just as the Boomers were a demographic bump at birth, so they will be in death.
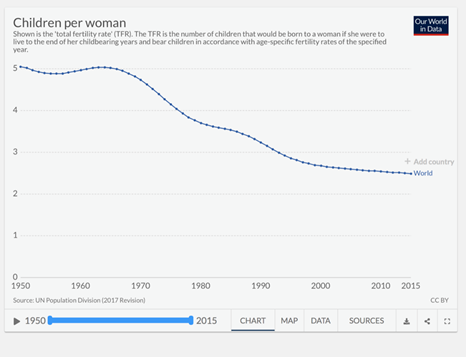
The total fertility rate of 2.1 children is considered to be replacement level. A TFR above that means population grows, and below means population shrinks, all other factors being equal. According to the CIA World Factbook 120 nations have a TFR which leads to losing population. Another 24 nations have a TFR just above replacement levels (2.12‚—2.5), and 78 nations are 2.5 or above and growing, while TFRs are falling across the globe.

Total Fertility Rate by year
In 27 nations, populations have decreased by “at least one per cent since 2010”, according to the UN. “Examples include Japan, which recorded 2.6 million more deaths than births from 2010 to 2019, and Ukraine, where deaths exceeded births by close to 2.3 million over that period. In 23 of the 27 countries or areas where the population declined between 2010 and 2019, more people left the country than arrived, that is, net international migration was negative”.
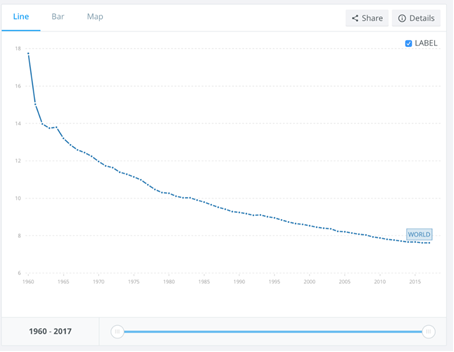
As dramatic as is the decrease in fertility rates, there is an even more dramatic decline in death rates. If we use the years picked by PMC, we find in 1967 the global death rate per 1,000 population was 12.585. Today the World Bank says it is 7.617.

Death rate per 1,000 globally. Source World Bank.
The UN says: “Two-thirds of the projected growth of the global population through 2050 will be driven by current age structures. It would occur even if childbearing in high-fertility countries today were to fall immediately to around two births per woman over a lifetime”. In other words, the world’s population growth is not primarily the result of too many births, but the result of fewer deaths.
This decline can’t go on forever. Like it or not. old people tend to die in large numbers and eventually all of them do! Pew Research reports UN data shows the median age of the world population is rising rapidly, which means the population is aging faster as birth rates plummet.
“The world’s median age is expected to increase to 42 in 2100, up from the current 31 — and from 24 in 1950. Between 2020 and 2100, the number of people aged 80 and older is expected to increase from 146 million to 881 million. Starting in 2073, it is projected that there will be more people aged 65 and older than under the age of 15 — the first time this will be the case. Contributing factors to the rise in the median age are the increase in life expectancy and falling fertility rates.”
The United Nation’s World Population Prospects 2019 notes, “In 2018, for the first time in history, persons aged 65 years or over worldwide outnumbered children under age five. Projections indicate that by 2050 there will be more than twice as many persons above 65 as children under five. By 2050, the number of persons aged 65 years or over globally will also surpass the number of adolescents and youth aged 15 to 24 years.”
James Peron is the president of the Moorfield Storey Institute and author of several books including Exploding Population Myths and The Liberal Tide. The views expressed in this article are those of the author and not necessarily those of the Free Market Foundation.